Assessing 2D and 3D Heatmaps for Comparative Analysis: An Empirical Study
 (opens in new tab)
Venue. CHI (2020)
Materials.
DOI(opens in new tab)
PDF(opens in new tab)
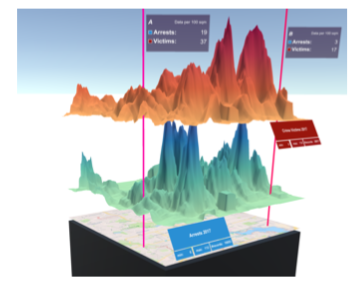
Abstract. Heatmaps are a popular visualization technique that encode 2D density distributions using color or brightness. Experimental studies have shown though that both of these visual variables are inaccurate when reading and comparing numeric data values. A potential remedy might be to use 3D heatmaps by introducing height as a third dimension to encode the data. Encoding abstract data in 3D, however, poses many problems, too. To better understand this tradeoff, we conducted an empirical study (N=48) to evaluate the user performance of 2D and 3D heatmaps for comparative analysis tasks. We test our conditions on a conventional 2D screen, but also in a virtual reality environment to allow for real stereoscopic vision. Our main results show that 3D heatmaps are superior in terms of error rate when reading and comparing single data items. However, for overview tasks, the well-established 2D heatmap performs better.
Link to this page: